Please visit our website Privacy Policy to see the privacy policy for our website.
You can also view our organisational privacy policy.

This strategy document sets out what we are going to do next to keep improving. It builds on and replaces our previous three-year rolling strategy, which we called ‘Our Plan’ and published annually. This new approach is designed to be more clearly forward looking, and to show you not just what we aim to achieve, but how we will deliver it and how we will measure success.
Starting from our vision of Making the West Midlands Safer, Stronger and Healthier , we have set 17 strategic goals for the next three years, each with at least one Key Performance Indicator which will help us determine whether we are achieving that goal. We will report on our progress every year through an Annual Report, in which we will highlight our successes and explain where we need to do more.
We have organised our strategic goals into four areas, aligned to the way we organise our service. However, while these are a convenient way to arrange our goals, everyone in our service has a responsibility to deliver against them and contribute to our intended outcomes.
All our strategic goals and performance measures then come together to form a ‘balanced scorecard’ which will be a simple, visual representation of our strategy for the next three years, all in one place. We’ll keep this live on our website, where you’ll be able to track our progress, as well as access wider performance data.
How we are going to deliver against each of our strategic goals is explained in more detail in our service delivery plans, and there are links to each provided within the relevant sections of this document. These are more detailed plans covering a specific area of our business, such as our Inclusion Action Plan or our Efficiency and Productivity Plan. Each will also have its own goals and measures but will always be contributing to the delivery of the overall strategic goals of the service.
The strategic goals we have set ourselves, and this strategy as a whole, inform and are informed by our Community Risk Management Plan (CRMP), which is in turn informed by your views and opinions as shared through our 2023 public consultation. The CRMP is an assessment of the foreseeable challenges and risks facing our communities and what needs to be done to meet them. We use this analysis to inform the strategic goals, as well as to determine the specific projects we will undertake to achieve those goals and address the risks.
You can read our CRMP document on our website LINK and explore the data and information that informs it. Also on our website, you can find out about the outcome of our consultation, and how that informed our planning.
As a public-funded emergency service we are here to serve you, and so our strategy has been designed for you and with your input.
It draws on your responses to our consultation undertaken in Summer 2023, where almost 6,000 of you told us your priorities, where we can do more, and the issues that matter to you most. You told us that you have high levels of trust in our service, and that you rated our services as excellent or good.
You also told us you wanted more community engagement, more safety advice, and a focus on new areas such as climate change. We have reflected these priorities within our strategic goals, alongside other commitments to ensure our services are effective and efficient.
This strategy sets out more clearly than ever what we will do to deliver against your priorities and our vision, and what you can expect from us. It gives you the information to understand how well we are delivering against our goals across every part of what we do.
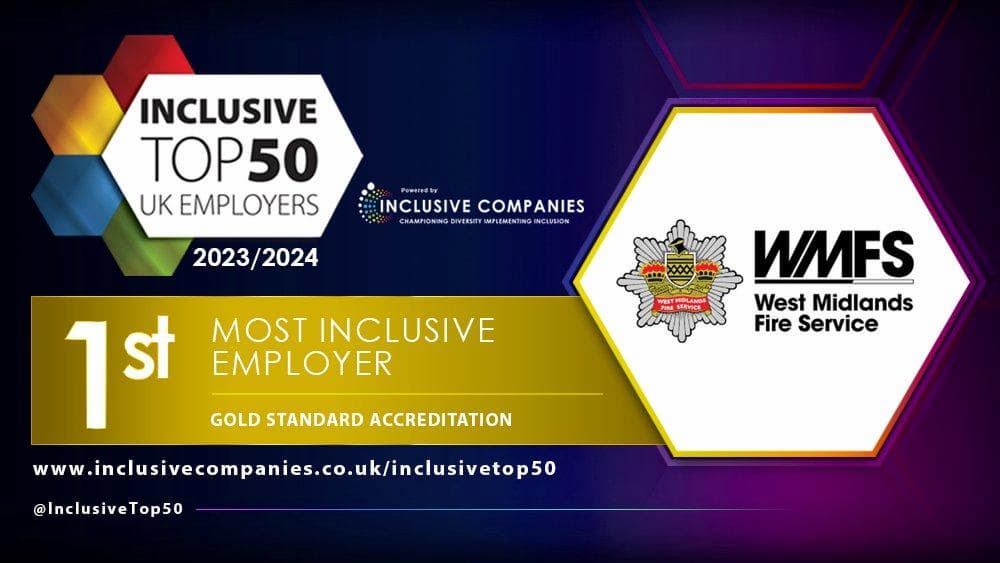
We are rightly proud of what this service has achieved, from recognition of our “outstanding” approach to risk by His Majesty’s Inspectorate of Constabulary and Fire & Rescue Services (HMICFRS), to twice being crowned the Inclusive Employers’ UK’s Most Inclusive Employer.
This strategy provides the direction for the service to continue improving and building upon that success.


The number of accidental fires in non-domestic premises
The number of false alarm calls due to faulty fire alarm equipment in dwellings and non-domestic premises
The number of deliberate fires in derelict buildings
The number of Safe and Well points achieved by the service (with average point score as a sub-PI)
The number of accidental dwelling fires
Risk-based attendance standard.
(Call handling time as sub-PI)
The percentage of Safe and Well visits referred by our partners.
Up to date and reviewed Business Continuity Plans.

Percentage Black and minority ethnic uniformed staff/all staff
Percentage female uniformed staff/all staff
Percentage of Staff trust in the service.
Percentage of completed IPDRs
Percentage of Staff reporting understanding of our core values.
Total number of injuries/total number of RIDDOR injuries
The average number of working days/shifts lost due to sickness – uniformed/all staff.
Percentage of Core CRA compliance


Combined IT and Data Operations availability, performance, and reliability metric.
Cyber Standards Compliance.
Percentage public and staff trust in service communications.


Achieving balanced budget.
Delivery of in-year efficiency target.
Overall Service Productivity.
Economic and Social Cost of Fire.
Total service carbon footprint/output
Service gas and electric usage